IRT analysis – a valuable tool, but only when appropriately applied

It is probably true to say that fewer than 1% of teachers have even a basic understanding of item response theory (IRT), yet this statistical theory is widely used in monitoring something that would be close to the heart of many teachers: improving the quality of schooling. Specifically, IRT lies behind most reliable national trends on learning outcomes, which in turn influence the public debates about where schooling systems are heading
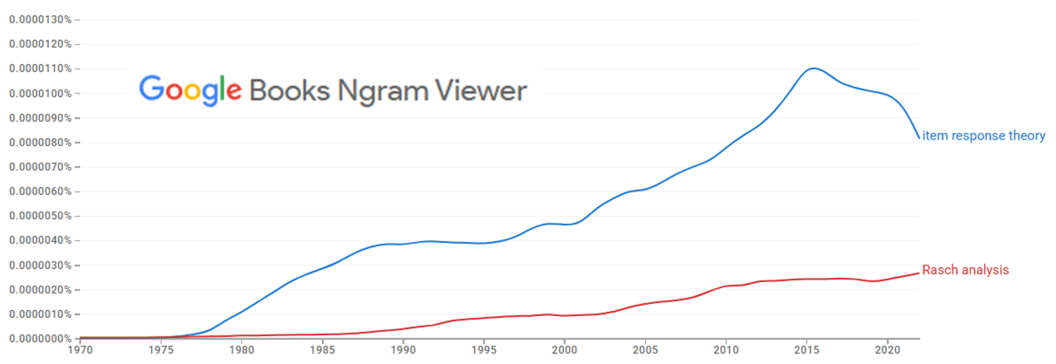
IRT and the related Rasch analysis are terms which have been increasingly present in the literature from the late 1970s, as the following graph from Google’s NGram shows. Thus, in the world of statistics, these are relatively recent creations.
There have been a few attempts to explain IRT in simple jargon-free terms. Let us attempt another one here, aimed at an imagined teacher. All teachers are familiar with classical test scores, as in 56% correct in a mathematics test. Good teachers know that 56% in one test will never mean exactly the same as 56% in a second test, even if both tests cover the same part of the curriculum, and the teacher tried hard to make the two tests equivalent. This is because if the tests contain different questions, these could have been harder in, say, the first test than the second, making it more difficult to achieve the 56% in the first test.
This would make it difficult to know with certainty whether, for instance, the grade 6 mathematics learners of 2025 performed better or worse than the grade 6 mathematics learners of 2023
One could of course repeat exactly the same test across the two years. Then results from a second round of testing would be the equivalent of those from the first round. However, all teachers know the risk of repeating exactly the same test. Learners tell each other about the test, and so repeated usage of the same test reduces its effectiveness.
But what if you repeat just some questions from the first round of a test and in a second round mix new and old questions? That would reduce the risk of learners knowing questions beforehand. And it would surely provide some basis for comparable results across the two rounds, at least in ways that two completely different tests would not. But how would one score the two tests? This is where IRT comes in.
IRT would use the questions which are common across the two tests as an anchor. It would then determine the difficulty of the questions which are not common across the two tests, on the basis of learner responses to both the common and non-common questions (or items). Then IRT would be in a position to produce a score for every learner from the first and second round of testing. These scores would be comparable because, for instance, if the non-common questions in 2023 were more difficult than those in 2025, the 2023 learners would be given credit for this.
What can be a bit complicated is that instead of producing classical scores, such as 56% correct, IRT produces IRT scores which are not the percentage correct. IRT scores are simply values showing which test-taker performed better than which other test-taker. It is common for IRT scores to assume the average in one year, say in 2023, is 500. Thus a learner obtaining 490 in 2025 would be performing worse than the average 2023 learner. A further complication is that IRT scores do not have a simple minimum and maximum, in the sense of the 0% and 100% of classical scores.
There is a further catch. Guides and tools for teachers, or individual schools, to use IRT remain scarce. But this should not detract from the fact that IRT is implementable by teachers, and is likely to become more common as more free and good software becomes available, and as teachers become more familiar with the concept, and see its value.
This explanation has used the teacher as a point of departure in part to encourage curious teachers to explore what is available, but also as a different approach to explaining the basics of an important but poorly understood concept.
Planners and researchers in the education field often struggle to understand IRT, yet they tend to have a good understanding of how traditional methods, such as classical scores, work. Indeed, many education planners and researchers were originally classroom teachers. This strengthens the argument for explaining IRT from the point of view of the teacher.
A key reason why we should have at least a basic grasp of IRT is that though IRT is at the heart of monitoring whether schooling systems are improving, there have been instances where the method has been incorrectly employed, leading to incorrect trend statistics. We need to know how to engage critically with the method, and ask the right questions.
There are of course many national and international assessments which use IRT properly and thus inform us reliably about trends. These assessments have helped us understand that historically improvements in the quality of schooling have occurred with painful slowness, even in the most successful countries. This in turn helps us to treat promises of quick fixes with due caution. Certainly, there are interventions which have proven to bring about positive change, but there appear to be limits to the speed with which large systems can improve.
Good assessments have also helped us understand that, at least in rich countries, the use of social media among the young appears to be having a devastating effect on learning. Yet there have been instances in the past where trends initially believed to be reliable have turned out to be substantively incorrect. While these are fortunately rare, they remind all of us in education to be vigilant and sufficiently critical of the statistics we see. While most of these anomalies have been due to sampling problems, problems in the psychometrics of assessment programmes, which would include IRT, can also be at fault.
What should we be looking out for if we want to be sure that IRT is properly implemented? There are several statistical tests psychometricians run, but for the layperson there are some basic things to look out for. First, it is worth noting that that IRT can be used in a number of ways, not all of which directly improve the comparability of results over time. In particular, IRT may be used only to determine the level of difficulty of different questions in a test, without using this information to produce IRT scores. In such a case, classical scores such as 56% correct would still apply, and the usual comparability problems associated with classical scores would remain.
One way of evaluating whether an assessment claiming to produce IRT scores really is producing such scores is the following. One can look at the underlying classical scores and find learners with the same classical score, for instance 56%. What IRT scores do these learners display? They should display a variety of IRT scores. This is because any two learners with 56% are likely to have obtained this through different combinations of questions answered correctly. The learner whose correctly answered questions were on average more difficult should have a higher IRT score, even if the classical scores are identical.
IRT use has become a marker of reliability, for good reasons. The incentive is high for an assessment programme to state prominently that it has made use of IRT. It is not just a question of having used IRT, however. An effective and reliable assessment programme will be transparent about exactly how IRT was used, and will make its data, anonymised of course, available to analysts in general so that its rigour can stand up to external scrutiny.
This blog text was produced as part of the AFLEARN initiative. From 13-17 April 2026 AFLEARN will be running an online course aimed at building psychometric literacy for education policy in Africa. Click here to find out more and apply.